Example Analysis
Here is a sample of the analysis that was done for all other gases for which we have received transmission spectrum data.
Acknowledgements
More detailed information about the analysis <Cooming Soon>
Analyzing the greenhouse properties of C2F6
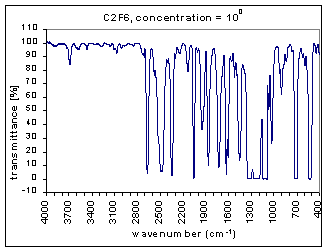
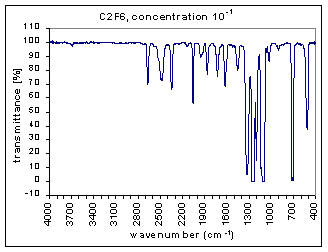
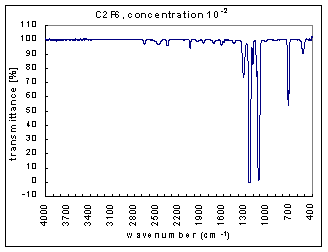
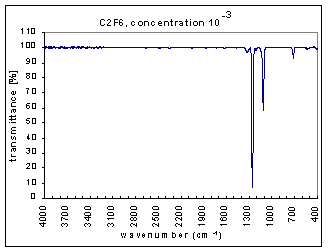
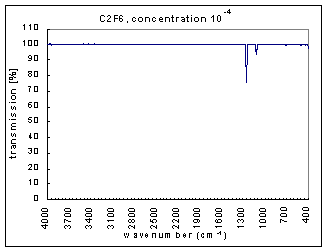
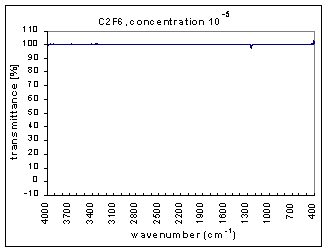
The measurements are the infra red (IR) transmission spectra for the gas C2F6, made using Fourier Transform Infra Red (FTIR) (Perkin Elmer 1725X FTIR). The transmission spectra was measured at different concentrations – 100, 10-1,…,10-7 (dilutions were made using Argon gas which does not have absorption bands at these wavenumbers). The path length was 100mm. The resolution is 1 cm-1 and the range of measurements is 400-4000 cm-1. The transmission spectra clearly show absorption bands (i.e. where the transmission is very low). These absorption bands become more pronounced at higher concentrations. The figures below show these transmission spectra - wavenumber vs. percent transmittance.
The strength of the bands was divided into three categories – strong, medium, and weak. The strong bands are the bands that were prominent at a concentration of 10-3; the medium bands became prominent at a concentration of 10-1; and the weak bands had a distinguishable effect only at a concentration of 100. (more detailed information on the selection criteria for the strength and range of the bands coming soon.)
Next, we determined the average transmission for each band; this was done for each concentration. The chart below shows the absorption bands, their relative strength, and their average transmission.
| strong bands | medium bands | |||||||||
| concentration | 1220-1285 | 1075-1160 | 660-740 | 2625-2690 | 2400-2625 | 2310-2400 | 2025-2075 | 1895-1985 | 1795-1895 | 1665-1795 |
| 1.00E+00 | 0.82 | 9.45 | 23.64 | 46.55 | 56.19 | 53.86 | 48.4 | 63.08 | 65.32 | 60.79 |
| 1.00E-01 | 21.22 | 28.35 | 46.64 | 88.19 | 91 | 89.02 | 85.34 | 94.5 | 93.63 | 92.81 |
| 1.00E-02 | 46.65 | 60.12 | 82.79 | 98.75 | 99.09 | 98.83 | 98.34 | 99.51 | 99.37 | 99.25 |
| 1.00E-03 | 71.84 | 89.63 | 97.97 | 100.08 | 100.12 | 100.09 | 100.03 | 100.13 | 100.1 | 100.05 |
| 1.00E-04 | 94.49 | 98.78 | 99.82 | 100.14 | 100.15 | 100.13 | 100.11 | 100.11 | 100.09 | 100.07 |
| 1.00E-05 | 99.49 | 99.97 | 100.1 | 100.21 | 100.19 | 100.16 | 100.12 | 100.12 | 100.11 | 100.1 |
| 1.00E-06 | 100.02 | 100.08 | 100.08 | 100.14 | 100.14 | 100.13 | 100.12 | 100.11 | 100.09 | 100.09 |
| 1.00E-07 | 100 | 100.03 | 100.01 | 100.02 | 100.04 | 100.04 | 100.03 | 100.03 | 100.02 | 100.02 |
| medium bands | weak bands | |||||||||
| concentration | 1575-1665 | 1410-1485 | 1285-1410 | 1160-1220 | 985-1045 | 475-580 | 3630-3745 | 2095-2195 | 1045-1075 | 785-950 |
| 1.00E+00 | 38.66 | 44.72 | 30.05 | 14.86 | 59.81 | 38.64 | 94.32 | 92.11 | 62.24 | 86.27 |
| 1.00E-01 | 86.35 | 89.62 | 60.83 | 62.14 | 93.75 | 77.1 | 99.29 | 99.1 | 94.86 | 98.38 |
| 1.00E-02 | 98.49 | 98.88 | 92.31 | 94.23 | 99.41 | 97.05 | 99.98 | 99.99 | 99.48 | 99.87 |
| 1.00E-03 | 99.98 | 100.03 | 99.33 | 99.58 | 100.07 | 99.88 | 100.12 | 100.21 | 100.09 | 100.12 |
| 1.00E-04 | 100.06 | 100.08 | 100.02 | 100.07 | 100.05 | 99.93 | 100.06 | 100.13 | 100.07 | 100.08 |
| 1.00E-05 | 100.11 | 100.12 | 100.11 | 100.12 | 100.08 | 100.19 | 100.4 | 100.13 | 100.11 | 100.1 |
| 1.00E-06 | 100.09 | 100.08 | 100.08 | 100.09 | 100.08 | 100.08 | 100.24 | 100.12 | 100.08 | 100.07 |
| 1.00E-07 | 100.01 | 100.01 | 100.01 | 100.02 | 100.02 | 100.1 | 99.93 | 100.03 | 100.03 | 100.02 |
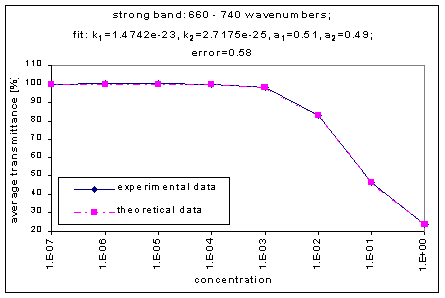
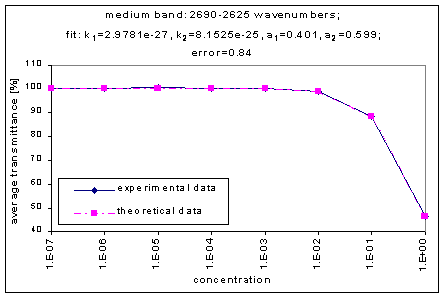
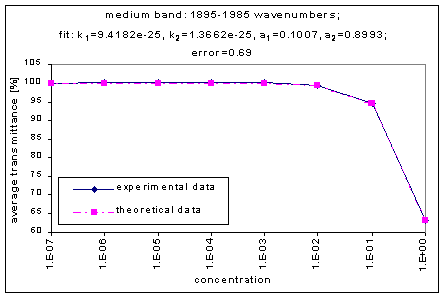
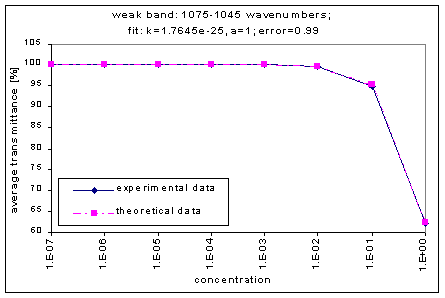
By graphing the average transmission at each concentration, we obtain graphs that look as follows (not all graphs shown - only a sample selection):
Average Transmission curves
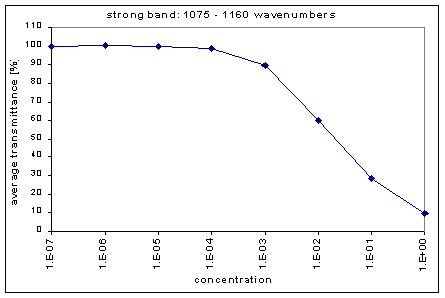
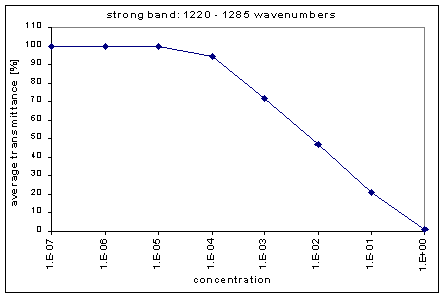
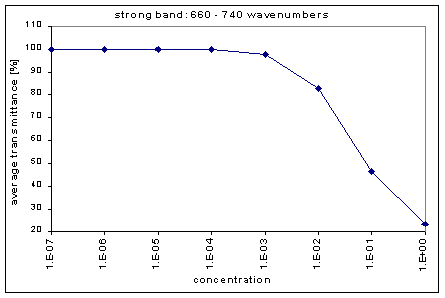
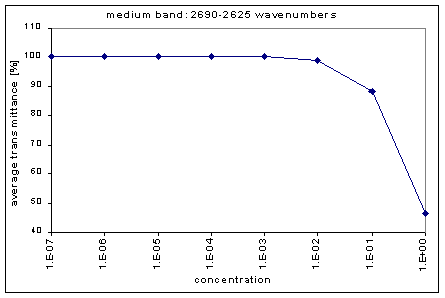
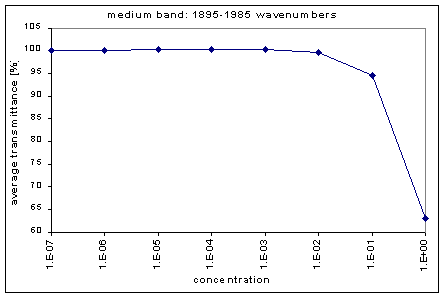
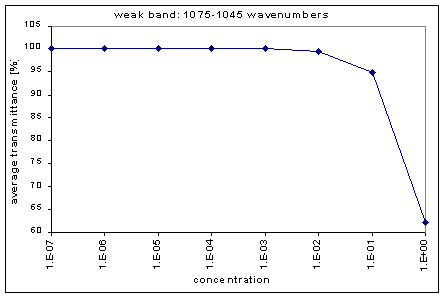
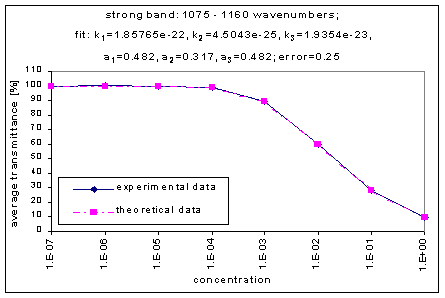
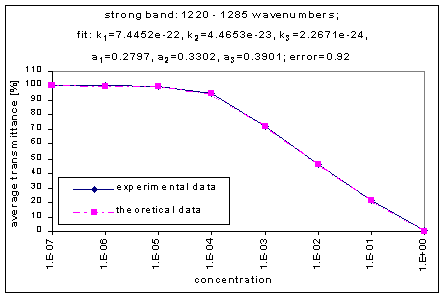
We fitted the average transmission curves (above) using an exponential sum. Each band was fitted separately. The first attempt utilized a one term exponential fit: transmission = a · e-kx , where a is a constant (always equal to 1 in this case), k is the absorption coefficient (k > = 0), and x is the gas concentration. The k value chosen was the one that resulted in the smallest error (the calculated error is the sum of the absolute difference between the theoretical and experimental data). If the curve could not be fitted using a one term exponential (i.e. the error was not below 1.35), a two-term exponential (transmission = a1 · e-k1x + a2 · e-k2x ; a1, a2 > = 0, a1 + a2 = 1) or three- term exponential (transmission = a1 · e-k1x + a2 · e-k2x + a3 · e-k3x ; a1, a2, a3 > = 0, a1 + a2 + a3 = 1) was used in order to minimize the error sufficiently. It is important to note that these solutions are most likely not unique, however, this is not important for this analysis since the objective of the exponential sum fits is to simply find a function that represents the data. Below is the table containing all k and a values for the absorption bands of C2F6.
|
|
band range |
Exponential |
Sum Fits |
|
|
|
|
|
|
Band strength |
D s [m-1] |
k1 |
k2 |
k3 |
a1 |
a2 |
a3 |
error |
|
Strong |
1220-1285 |
7.4452e-22 |
4.4653e-23 |
2.2671e-24 |
0.2797 |
0.3302 |
0.3901 |
0.92 |
|
|
1075-1160 |
1.85765e-22 |
4.5043e-25 |
1.9354e-23 |
0.201 |
0.317 |
0.482 |
0.25 |
|
|
660-740 |
1.4742e-23 |
2.7175e-25 |
|
0.51 |
0.49 |
|
0.58 |
|
Medium |
2625-2690 |
2.9781e-27 |
8.1525e-25 |
|
0.401 |
0.599 |
|
0.84 |
|
|
2400-2625 |
8.7853e-25 |
6.1423e-26 |
|
0.38 |
0.62 |
|
0.87 |
|
|
2310-2400 |
5.2116e-26 |
1.0684e-24 |
|
0.593 |
0.407 |
|
0.75 |
|
|
2025-2075 |
2.4085e-24 |
1.705e-25 |
|
0.236 |
0.764 |
|
0.82 |
|
|
1895-1985 |
9.4182e-25 |
1.3662e-25 |
|
0.1007 |
0.8993 |
|
0.69 |
|
|
1795-1895 |
6.4959e-25 |
2.2708e-26 |
|
0.3755 |
0.6245 |
|
0.57 |
|
|
1665-1795 |
3.7226e-24 |
1.6714e-25 |
|
0.0475 |
0.9425 |
|
0.57 |
|
|
1575-1665 |
3.4732e-24 |
3.1195e-25 |
|
0.107 |
0.893 |
|
0.68 |
|
|
1410-1485 |
4.523e-24 |
2.8068e-25 |
|
0.0493 |
0.9507 |
|
0.64 |
|
|
1285-1410 |
7.2442e-24 |
2.4941e-25 |
|
0.4125 |
0.5875 |
|
0.5 |
|
|
1160-1220 |
4.5416e-24 |
4.9548e-25 |
|
0.4377 |
0.5623 |
|
0.55 |
|
|
985-1045 |
1.1019e-24 |
1.5523e-25 |
|
0.1 |
0.9 |
|
0.48 |
|
|
475-580 |
2.416e-24 |
1.4183e-25 |
|
0.4354 |
0.5646 |
|
0.6 |
|
Weak |
3630-3745 |
2.1777e-26 |
|
|
1 |
|
|
1.07 |
|
|
2095-2195 |
3.0525e-26 |
|
|
1 |
|
|
0.81 |
|
|
1045-1075 |
1.7645e-25 |
|
|
1 |
|
|
0.99 |
|
|
785-950 |
5.5839e-26 |
|
|
1 |
|
|
0.58 |
Future analysis
Utilizing the exponential sum fits and the Planck function1, the effect of each band as a greenhouse warmer will be determined. From these calculations, a gray absorber (an equivalent uniform absorption along the entire IR spectrum) will be determined. Ultimately, the gray absorbers will be used to calculate the greenhouse warming of Mars when different concentrations of gases are introduced into the atmosphere.
1 – The Planck function is used to calculate the strength of the electromagnetic radiation emissions at different wavelengths by an object at a certain temperature (the blackbody radiation of the object).
The data used was obtained by
Hirofumi Hashimoto
Institute of Engineering and Mechanics
University of Tsukuba
Tsukuba, 305-8573 Japan
Phone/Fax: +81-298-53-6192
e-mail: hhashi@kz.tsukuba.ac.jp
Web page design: Katie Strong
Data Analysis: Margarita Marinova
Back