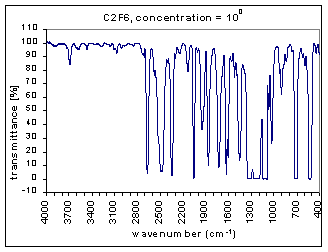
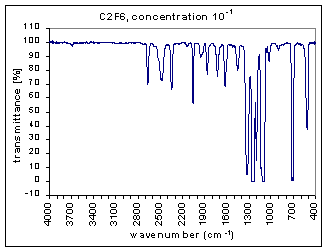
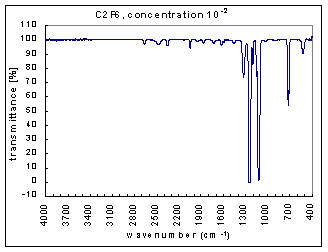
10-3
10-4
10-5
10-6
10-7
C2F6
Some of the Spectra:
Download the raw data:
The identified bands and their average transmission for selected concentrations:
| strong bands | medium bands | |||||||||
| concentration | 1220-1285 | 1075-1160 | 660-740 | 2625-2690 | 2400-2625 | 2310-2400 | 2025-2075 | 1895-1985 | 1795-1895 | 1665-1795 |
| 1.00E+00 | 0.82 | 9.45 | 23.64 | 46.55 | 56.19 | 53.86 | 48.4 | 63.08 | 65.32 | 60.79 |
| 1.00E-01 | 21.22 | 28.35 | 46.64 | 88.19 | 91 | 89.02 | 85.34 | 94.5 | 93.63 | 92.81 |
| 1.00E-02 | 46.65 | 60.12 | 82.79 | 98.75 | 99.09 | 98.83 | 98.34 | 99.51 | 99.37 | 99.25 |
| 1.00E-03 | 71.84 | 89.63 | 97.97 | 100.08 | 100.12 | 100.09 | 100.03 | 100.13 | 100.1 | 100.05 |
| medium bands | weak bands | |||||||||
| concentration | 1575-1665 | 1410-1485 | 1285-1410 | 1160-1220 | 985-1045 | 475-580 | 3630-3745 | 2095-2195 | 1045-1075 | 785-950 |
| 1.00E+00 | 38.66 | 44.72 | 30.05 | 14.86 | 59.81 | 38.64 | 94.32 | 92.11 | 62.24 | 86.27 |
| 1.00E-01 | 86.35 | 89.62 | 60.83 | 62.14 | 93.75 | 77.1 | 99.29 | 99.1 | 94.86 | 98.38 |
| 1.00E-02 | 98.49 | 98.88 | 92.31 | 94.23 | 99.41 | 97.05 | 99.98 | 99.99 | 99.48 | 99.87 |
| 1.00E-03 | 99.98 | 100.03 | 99.33 | 99.58 | 100.07 | 99.88 | 100.12 | 100.21 | 100.09 | 100.12 |
Download the above chart
(comma seperated values data file)
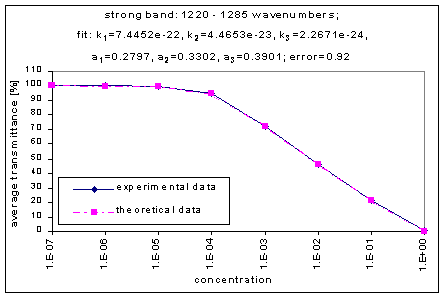
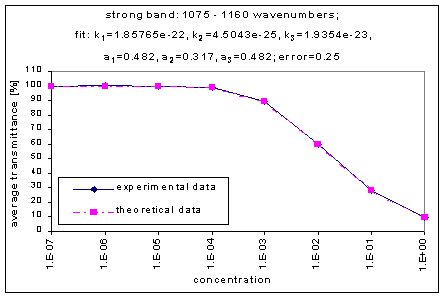
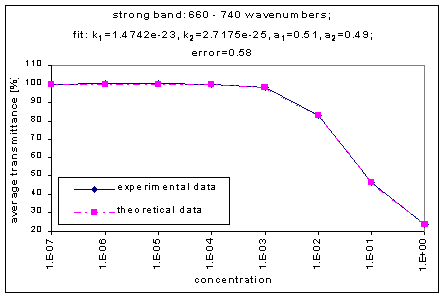
Exponential Sum Fitting of the Average Transmission (only strong bands
shown):
Links to remaining graphs:
2625-2690
2400-2625
2310-2400
2025-2075
1895-1985
1795-1895
1665-1795
1575-1665
1410-1485
1285-1410
1160-1220
985-1045
475-580
3630-3745
2095-2195
1045-1075
785-950
k and a Values for the Exponential Sum Fits
|
band range |
Exponential Sum Fits |
|||||||
|
Band strength |
D s [m-1] |
k1 |
k2 |
k3 |
a1 |
a2 |
a3 |
error |
|
Strong |
1220-1285 |
7.4452e-22 |
4.4653e-23 |
2.2671e-24 |
0.28 |
0.33 |
0.39 |
0.92 |
|
1075-1160 |
1.85765e-22 |
4.5043e-25 |
1.9354e-23 |
0.201 |
0.317 |
0.482 |
0.25 |
|
|
660-740 |
1.4742e-23 |
2.7175e-25 |
0.51 |
0.49 |
0.58 |
|||
|
Medium |
2625-2690 |
2.9781e-27 |
8.1525e-25 |
0.401 |
0.599 |
0.84 |
||
|
2400-2625 |
8.7853e-25 |
6.1423e-26 |
0.38 |
0.62 |
0.87 |
|||
|
2310-2400 |
5.2116e-26 |
1.0684e-24 |
0.593 |
0.407 |
0.75 |
|||
|
2025-2075 |
2.4085e-24 |
1.705e-25 |
0.236 |
0.764 |
0.82 |
|||
|
1895-1985 |
9.4182e-25 |
1.3662e-25 |
0.101 |
0.899 |
0.69 |
|||
|
1795-1895 |
6.4959e-25 |
2.2708e-26 |
0.376 |
0.624 |
0.57 |
|||
|
1665-1795 |
3.7226e-24 |
1.6714e-25 |
0.048 |
0.942 |
0.57 |
|||
|
1575-1665 |
3.4732e-24 |
3.1195e-25 |
0.107 |
0.893 |
0.68 |
|||
|
1410-1485 |
4.523e-24 |
2.8068e-25 |
0.049 |
0.951 |
0.64 |
|||
|
1285-1410 |
7.2442e-24 |
2.4941e-25 |
0.412 |
0.588 |
0.5 |
|||
|
1160-1220 |
4.5416e-24 |
4.9548e-25 |
0.438 |
0.562 |
0.55 |
|||
|
985-1045 |
1.1019e-24 |
1.5523e-25 |
0.1 |
0.9 |
0.48 |
|||
|
475-580 |
2.416e-24 |
1.4183e-25 |
0.435 |
0.565 |
0.6 |
|||
|
Weak |
3630-3745 |
2.1777e-26 |
1 |
1.07 |
||||
|
2095-2195 |
3.0525e-26 |
1 |
0.81 |
|||||
|
1045-1075 |
1.7645e-25 |
1 |
0.99 |
|||||
|
785-950 |
5.5839e-26 |
1 |
0.58 |
The error is the sum of the absolute difference between the experimental and the theoretical data values.
To Download the chart above (comma separated data values)
The data used was obtained by
Hirofumi Hashimoto
Institute of Engineering and Mechanics
University of Tsukuba
Tsukuba, 305-8573 Japan
Phone/Fax: +81-298-53-6192
e-mail: hhashi@kz.tsukuba.ac.jp
Web page design: Katie Strong
Data Analysis: Margarita
Marinova
Back