10-3
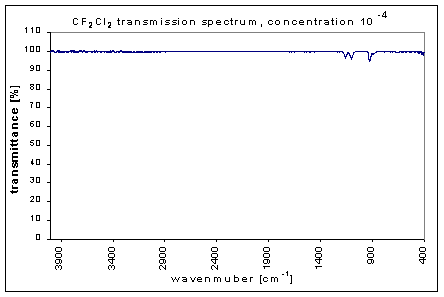
10-4
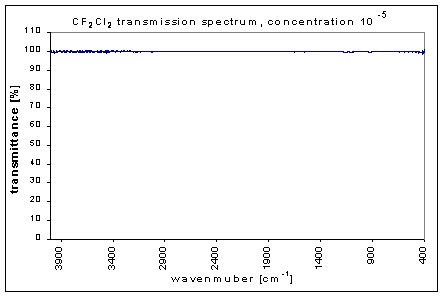
10-5
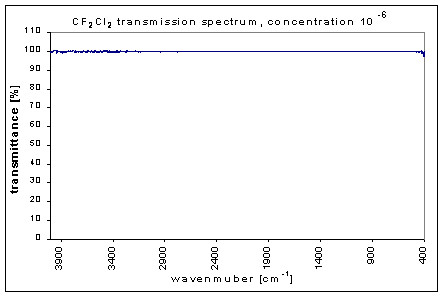
10-6
10-7
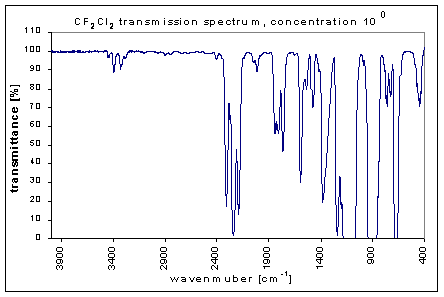
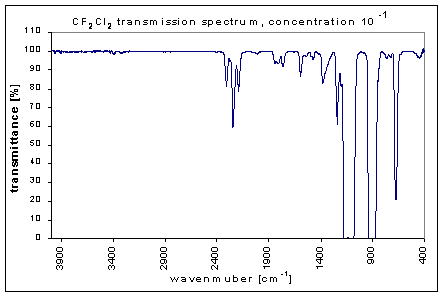
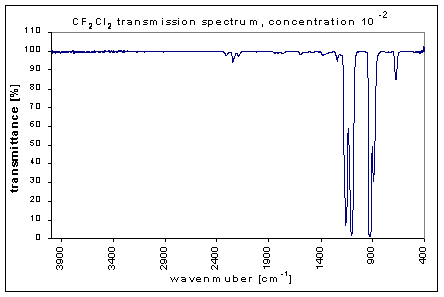
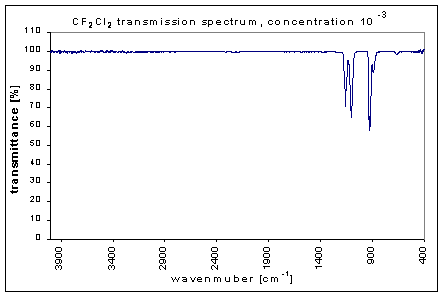
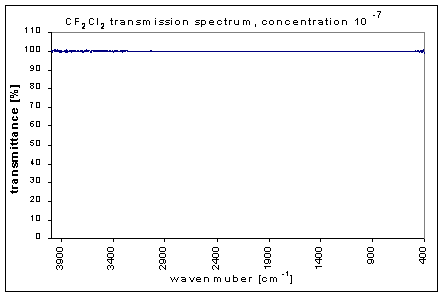
C F2Cl2
Some of the Spectra:
Download the raw data:
The identified bands and their average transmission for selected concentrations:
| strong bands | medium bands | |||||||
| concentration | 1185-1130 | 1130-1045 | 960-815 | 2335-2150 | 1605-1495 | 1440-1265 | 1265-1185 | 695-605 |
| 1.00E+00 | 0.101 | 9.30 | 18.91 | 41.55 | 74.08 | 65.74 | 21.53 | 44.40 |
| 1.00E-01 | 3.06 | 24.82 | 38.40 | 87.51 | 96.12 | 94.26 | 80.22 | 72.19 |
| 1.00E-02 | 36.19 | 49.59 | 62.23 | 98.53 | 99.52 | 99.34 | 97.64 | 95.58 |
| 1.00E-03 | 87.25 | 87.94 | 90.96 | 99.89 | 99.91 | 99.94 | 99.76 | 99.53 |
| weak bands | ||||||
| concentration | 3405-3240 | 2085-1950 | 1870-1700 | 1495-1440 | 795-695 | 530-400 |
| 1.00E+00 | 96.00 | 96.08 | 73.14 | 86.68 | 84.03 | 89.78 |
| 1.00E-01 | 99.78 | 99.62 | 96.29 | 98.33 | 98.03 | 98.93 |
| 1.00E-02 | 100.0 | 99.92 | 99.56 | 99.78 | 99.79 | 100.0 |
| 1.00E-03 | 99.86 | 100.0 | 99.94 | 99.95 | 99.97 | 100.0 |
Download the above chart
(comma seperated values data file)
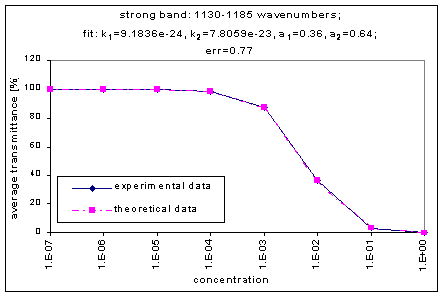
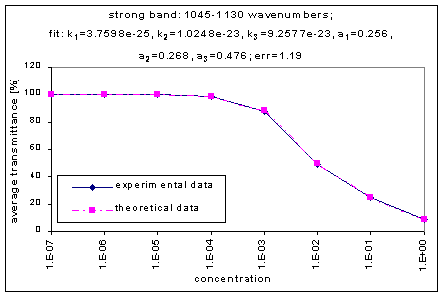
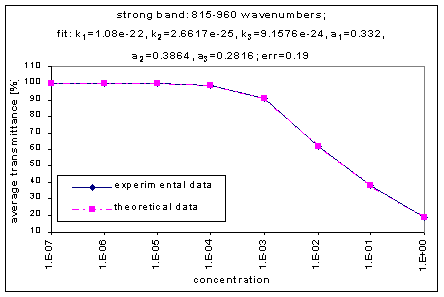
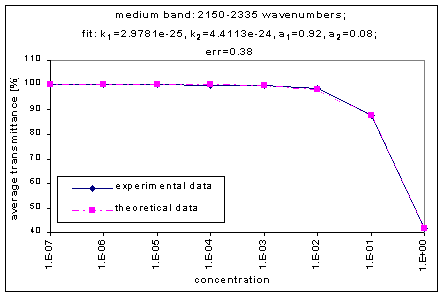
Exponential Sum Fitting of the Average Transmission (only strong bands
shown):
Links to remaining graphs:
2150-2335
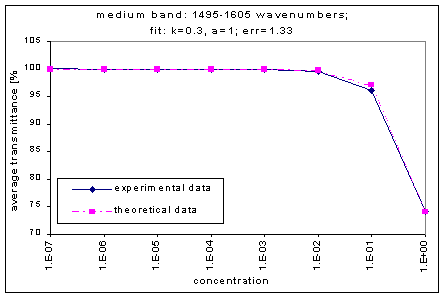
1495-1605
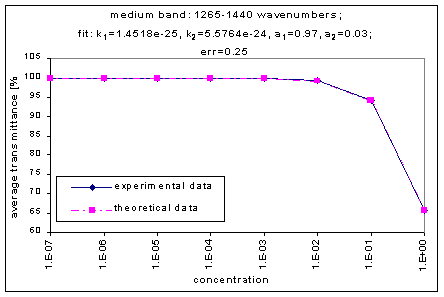
1265-1440
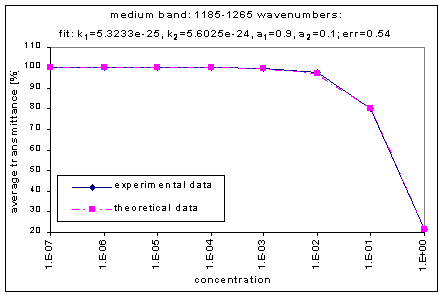
1185-1265
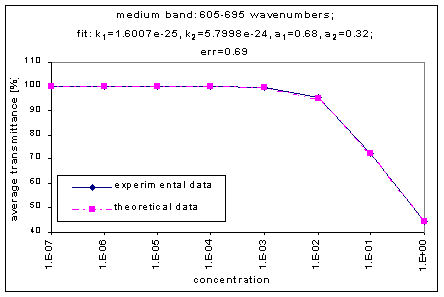
605-695
3240-3405
1950-2085
1700-1870
1440-1495
695-795
400-530
k and a Values for the Exponential Sum Fits
|
band range |
Exponential Sum Fits |
|||||||
|
Band strength |
D s [m-1] |
k1 |
k2 |
k3 |
a1 |
a2 |
a3 |
error |
|
Strong |
1130-1185 |
9.1836e-24 |
7.8059e-23 |
0.36 |
0.64 |
0.77 |
||
|
1045-1130 |
3.7598e-25 |
1.0248e-23 |
9.2577e-23 |
0.256 |
0.268 |
0.476 |
1.19 |
|
|
815-960 |
1.08e-22 |
2.6617e-25 |
9.1576e-24 |
0.332 |
0.386 |
0.282 |
0.19 |
|
|
Medium |
2150-2335 |
2.9781e-25 |
4.4113e-24 |
0.92 |
0.08 |
0.38 |
||
|
1495-1605 |
1.1168e-25 |
1 |
1.33 |
|||||
|
1265-1440 |
1.4518e-25 |
5.5764e-24 |
0.97 |
0.03 |
0.25 |
|||
|
1185-1265 |
5.3233e-25 |
5.6025e-24 |
0.9 |
0.1 |
0.54 |
|||
|
605-695 |
1.6007e-25 |
5.7998e-24 |
0.68 |
0.32 |
0.69 |
|||
|
Weak |
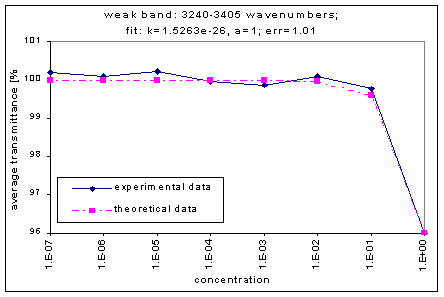
3240-3405 |
1.5263e-26 |
1 |
1.01 |
||||
|
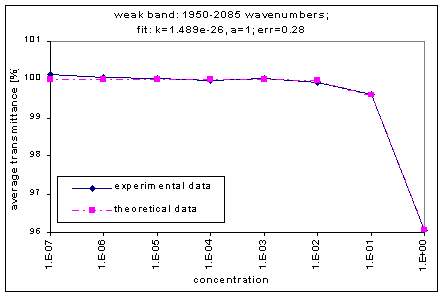
1950-2085 |
1.489e-26 |
1 |
0.28 |
|||||
|
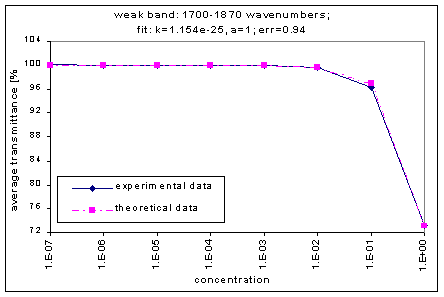
1700-1870 |
1.154e-25 |
1 |
0.94 |
|||||
|
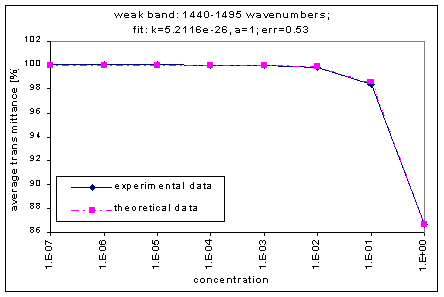
1440-1495 |
5.2116e-26 |
1 |
0.53 |
|||||
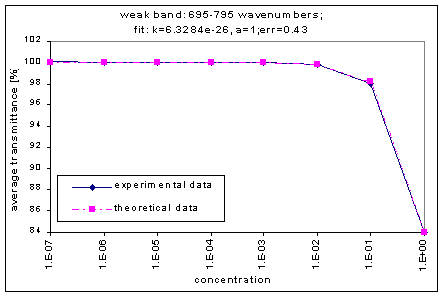
|
695-795 |
6.3284e-26 |
1 |
0.43 |
|||||
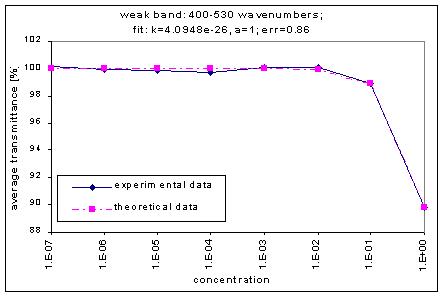
|
400-530 |
4.0948e-26 |
1 |
0.86 |
The error is the sum of the absolute difference between the experimental and the theoretical data values.
To Download the chart above (comma separated data values)
The data used was obtained by
Hirofumi Hashimoto
Institute of Engineering and Mechanics
University of Tsukuba
Tsukuba, 305-8573 Japan
Phone/Fax: +81-298-53-6192
e-mail: hhashi@kz.tsukuba.ac.jp
Web page design: Katie Strong
Data Analysis: Margarita Marinova
Back