Issue 3, May 1984 - Plotting in 3D (part 1 of 2)
| Home | Contents | KwikPik |
| Issue 4 | part 2: "Spherical Co-ordinates" |
| This program is available on "ZIPi'T'ape", which holds the files for both parts of the article. | |
| The concepts behind computer-aided design (CAD) and, in particular, the delights of three-dimensional plotting, are such that they have usually remained the preserve of 'big' computers. Mathematician and engineer Damir Skrgatic sets out over this issue and the next to prove that usefulness in this area is within the reach of our honest but humble eight-bitters. | ||
|---|---|---|
| P L O T T I N G I N 3 D / P A R T O N E GRAPHICS & MATHEMATICS |
||
|
For many of its users, maths fascinates firstly for its beauty and
elegance in dealing with complex
manipulations and relationships, and
secondly as a tool which seems
almost to possess a mind of its own.
Providing that the rules of the 'game'
are not broken, it can lead the faithful
along a complex path of calculations
to what sometimes turns out to be a
quite unexpected solution. (Take, for
instance, the supreme examples of
relativity and quantum mechanics,
where results obtained through
mathematics contradict everyday
common sense!) But your author must admit that, until the advent of the microcomputer, this fascination with maths proved less than faithful. All too often when trying to solve a problem using pen and paper, the calculations became too complicated to continue. It was like fighting with an octopus - you escape one set of arms only to fall foul of the next! But how can microcomputers help? Well, even the cheapest available are programmed to carry out mathematical calculations at speeds far beyond our imagination. Thousands of repetitive calculations are easily performed on the execution of a single line of a Basic program. Programs can be written not only to perform these calculations but also to make 'logical' decisions about which formulae should be selected, dependent on interaction between the user and the machine. Nowhere else are these advantages more useful than in the field of computer graphics. However, the demands on computer power (both speed and storage capacity) are enormous and this is why graphics programs used for computer aided design (CAD) have usually had to run on the world's most advanced machines - typically, 32- and 48-bit machines with ultra-fast parallel processors. These machine code programs are also assisted by special hardware for fast number crunching and display processing. No wonder then the scarcity of graphics programs written for eight-bit machines in general and home computers in particular. But although CAD seems far beyond their power capability, various programs for fun and education have been devised and our articles will attempt to describe |
some of the concepts used in 3D plotting.
PROJECT OUTLINEThe emphasis here will be on model-ling shapes and objects using mathematical functions rather than the plotting of individual points in space. With the choice of a suitable system of co-ordinates, geometrical models can easily be rotated, translated or scaled in size without the need for matrix transformations (see Part 2 in our next issue). This rather unusual approach can produce quite a variety of symmetric figures in perspective.Anticipating three different kinds of reader, it seemed best to include a reasonably self-contained 3D plotting program with full listing. Maths wizards with Basic experience will probably 'eat their way' through the routines and so also may the reader who is not interested in the maths and who merely wishes to key in the program and have some fun following the examples given. Having dealt with these two extremes, the rest of the [article] |
has been written from the point of
view of those wishing to learn, use
and further develop the main concept
used in the program and examples.
(By the way, the full derivation of the
mathematical formulae has been
extracted from the main text and
dumped in the Appendix, together
with a suggested list for further reading.) Let's now enter the main
program and, once that's been
successfully achieved, try some of the
parameter examples shown.
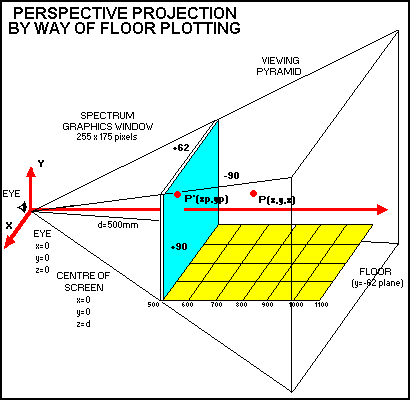
LOOKING INTO PERSPECTIVEPerspective projection can now be introduced by way of the 'floor' plotting subroutine at line 520; it's also illustrated by further examples shown in the Perspective Projection diagram.There are a number of basic assumptions made at this point: 1. The origin of the rectangular co-ordinate system is in the observer's eye. 2. All distances are expressed in millimetres (other units can easily be |

| ||
|
adopted as long as they are used
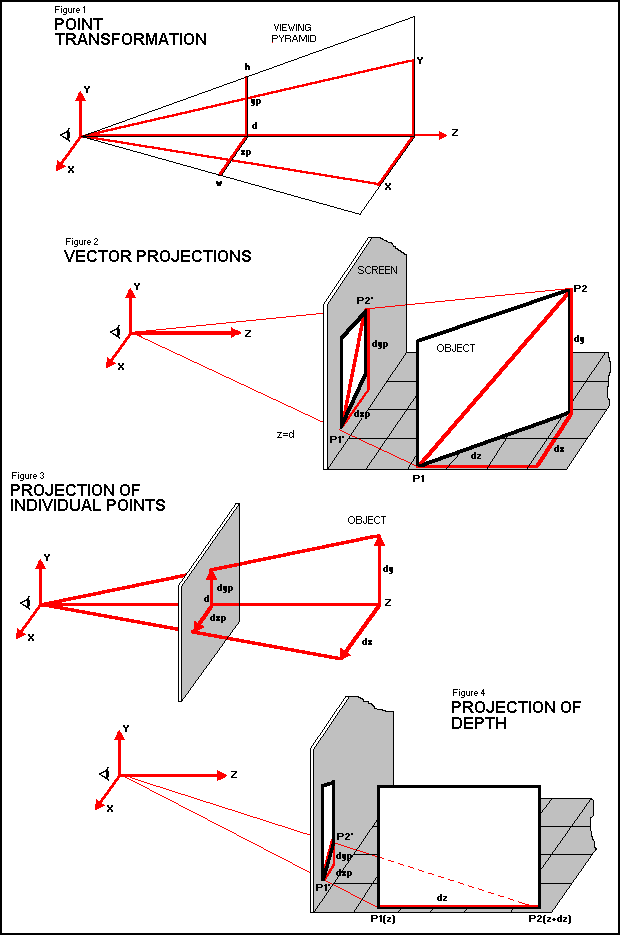
consistently throughout). 3. Millimetres (mm) are converted to pixels only in the lines of the program which use DRAW and PLOT statements. 4. The number of pixels/mm (p) for the Spectrum graphics window on a 12-inch TV is assumed to be equal to 1.41 (255/180 = 1.41). This nominal value is used throughout. 5. The screen window on your TV should first be plotted using the sub- routine at line 450, and then measured with a ruler so that the real size in millimetres can be entered in line 50. If your screen is around 12 inches then line 50 values are correct and program execution can be continued by pressing the CONTinue key. The centre of the screen is at: x=0, y=0, and z=d=500mm (ie. with your eye looking straight at the screen from the distance of half a metre). 6. The object can be placed anywhere within the viewing pyramid which is solely determined by the ratio of the screen size and the eye- screen distance (d). A large screen and a short eye-screen distance will result in the rapidly diverging pyramid, ie. similar to a wide aperture in a photographic lens. Lines 290 to 360 limit or 'clip' the parts of the 3D object which fall outside the viewing pyramid. 7. The general conditions to be met for the point to lie within the viewing pyramid are (see the Appendix for a fuller explanation, equation 2a): -z*w/d <= x <= z*w/d (where w is half of the screen window width in millimetres) and: z*h/d <= y <= z*h/d (where h is half of the screen window height in millimetres). The values in the program (lines 290 to 360) correspond to the viewing pyramid of d=500mm, and the Spectrum graphics window on a 12-inch TV. 8. The clipping conditions in practice are slightly more complicated due to the addition of dx and dy which are incremental (vector) components corresponding to x and y increments used in the Spectrum DRAW statement. This Spectrum instruction is slightly non- standard in that it only determines the length and direction of a line (what's known as a vector in maths notation) while the starting point of the vector is the pixel occupied by the last PLOT or DRAW statement. Thus, every DRAW statement must be preceded by a PLOT statement which sets the starting point. 9. Perspective projection of a point, P(x,y,z), on to the screen, P(xp, yp), is based on a simple relationship between the similar triangles, Odxp and Ozx, as shown in Figure 1 in the Appendix. After simple manipulation: xp = x*d/z (1) and: | THE 3D PLOTTING PROGRAM | |
|---|---|---|
| COMMENT | LISTING | |
| Goes to the 'draw screen window' routine at line 450. |
40 GO SUB 450: STOP
| |
| Prints the drawing parameters on-screen. |
50 PRINT AT 21,13;"Y=-62mm";AT 11,26;"x=90mm";AT 0,13;"y=62mm";AT 11,0;"x=-90mm"
| |
| Define the variables, p and d. |
60 LET p=1.41
| |
| Collect the user-defined parameters and print up a flashinh message to tell the user that the necessary calculations are being undertaken by the computer. |
80 GO SUB 520
| |
| Set the longitude and latitude increments in degrees. |
170 LET db=360/sb
| |
| Set up a FOR-NEXT loop, which is eventually returned by lines 420 and 430. |
190 FOR b=b0 TO 360+b0 STEP db
| |
| Convert the spherical co-ordinates (R,a,b) to cartesian co-ordinates (x,y,,z). |
220 LET x=R*COS (PI/180*a)*COS (PI/180*b)+x0
| |
| Carry out the clipping outside the viewing pyramid. |
290 IF x>z/5.6 THEN LET x=z/5.6
| |
| Set the perspective projections for x, y and z. |
370 LET xp=x*d/z: LET yp=y*d/z
| |
| Plot the projections in pixels (p=pixels/mm). |
380 PLOT xp*p+128,yp*p+87
| |
| Set the vector perspective projections. |
390 LET dxp=dx*d/z+x*dk: LET dyp=dy*d/z+y*dk
| |
| Sets the colour coded depth. |
400 LET e=ABS ((z-d)/200)
| |
| Draws the vector projections in pixels. |
410 DRAW INK e;dxp*p,dyp*p
| |
| COMMENT | LISTING |
yp = y*dz (1)
ie. projections, xp and yp, are inversely proportional to depth, z. The perspective will now be demonstrated by way of the routine used in the program to plot the 'floor' in a wire- frame fashion. In maths notation, this represents a plot of y=-62mm plane as shown in the Perspective Projection diagram. Looking at the program, line by line, the following can be seen: Lines 530 and 540 define the size of the plane, ie. z (depth) between 500mm and 1100mm, and x (width) between -90mm and +90mm. Lines 550 and 560 are direct applications of equations (1), ie. perspective projections of each intersection of 'wires' in the plane, y=-62=constant. Line 580 plots projections, xp and yp, expressed in pixels (multiplying with p) and sets the PLOT origin in the middle of the screen window (255 by 175) pixels. Line 590 defines the decrement of perspective scale factor, dk, as z is incremented by dz=70. This is necessary in order to work out the projected x and y decrements as a result of an increase in depth, dz. Line 600 contains the first DRAW statement which draws a line on the screen corresponding to the projection of the increment (vector), dz, through the application of dk. Line 610 resets the DRAW vector back to 580. Line 620 converts an increment in x (dx=20) to its projection, dxp. Line 640 contains the second DRAW statement and draws a projection corresponding to a dx=20 increment PLANE PLOT SUMMARY'Wire' cross sections in the 'floor' were obtained through a direct application of equations (1) and the PLOT statement. A DRAW statement is used to draw the projections of dz and dx increments, which are actually vectors since they not only have a length but also a direction in space. In fact, it wouldn't be difficult to plot a 'wire-frame' of any plane. For example, the x=90 plane can be plotted by substituting y for x in the following program: 520 REM 'Right wall, x=90 plane'
| |||||||||||||||||||||||||||||||||||||||||||||||||||||||||||||||||||
| Return the program to the beginning of the 'plotting' routine begun in lines 190 and 200. |
420 NEXT a
| ||||||||||||||||||||||||||||||||||||||||||||||||||||||||||||||||||||
| Returns the program to line 90 to collect more user-defined parameters to draw another object. |
440 GO TO 90
| ||||||||||||||||||||||||||||||||||||||||||||||||||||||||||||||||||||
| The routine called at line 40 to draw the screen window. |
450 PLOT 0,0
| ||||||||||||||||||||||||||||||||||||||||||||||||||||||||||||||||||||
| The routine called to plot the floor in perspective (wire-frame plot of the y=-62 plane). |
530 FOR z=d TO d+600 STEP 100
| ||||||||||||||||||||||||||||||||||||||||||||||||||||||||||||||||||||
| Sets the perspective projection of x on the screen. |
550 LET xp=x*d/z
| ||||||||||||||||||||||||||||||||||||||||||||||||||||||||||||||||||||
| Sets the perspective projection of y on the screen. |
560 LET yp=-62*d/z
| ||||||||||||||||||||||||||||||||||||||||||||||||||||||||||||||||||||
| Sets the colour coded depth; ie. z=d, f=0 gives black. |
570 LET f=INT ((z-d)/200)
| ||||||||||||||||||||||||||||||||||||||||||||||||||||||||||||||||||||
| Plots the projections xp and yp in pixels; 128 and 87 are pixel co-ordinates of the screen centre. |
580 PLOT xp*p+128,yp*p+87
| ||||||||||||||||||||||||||||||||||||||||||||||||||||||||||||||||||||
| Sets the perspective scale factor decrement as a function of dz=70. |
590 LET dk=d/(z+70)-d/z
| ||||||||||||||||||||||||||||||||||||||||||||||||||||||||||||||||||||
| Draws perspective projections of a vector dz in pixels. |
600 DRAW INK f;x*dk*p,-62*dk*p
| ||||||||||||||||||||||||||||||||||||||||||||||||||||||||||||||||||||
| Resets the vector to 580. |
610 PLOT xp*p+128,yp*p+87
| ||||||||||||||||||||||||||||||||||||||||||||||||||||||||||||||||||||
| Sets the perspective projection of an increment dx=20. |
620 LET dxp=20*d/z
| ||||||||||||||||||||||||||||||||||||||||||||||||||||||||||||||||||||
| Limits the draw vector to within the screen window. |
630 IF x+22.5>90 THEN LET dxp=0
| ||||||||||||||||||||||||||||||||||||||||||||||||||||||||||||||||||||
| Draws the dx projection in pixels. |
640 DRAW INK f;dxp*p,0
| ||||||||||||||||||||||||||||||||||||||||||||||||||||||||||||||||||||
| Returns the program for new values of x and y. |
650 NEXT x
| ||||||||||||||||||||||||||||||||||||||||||||||||||||||||||||||||||||
| Returns to the main program. |
670 RETURN
| ||||||||||||||||||||||||||||||||||||||||||||||||||||||||||||||||||||
|
|||||||||||||||||||||||||||||||||||||||||||||||||||||||||||||||||||||
600 DRAW INK f;90*dk*p,y*dk*pSimilarly, the the z=1100 plane could be plotted using the following program: 520 REM 'Back wall'Alternatively, all three planes could be combined into a 'bottom-right corner of a room' by writing a main program with the three examples used as sub- routines. A side view of a 'house with three floors' can easily be generated from the original floor, y=-62, by adding the following lines: 517 REM 'Three floors'The analogy could be taken even further, eg. for plotting a plane under |
any orientation and, with a combination
of several planes, one could generate
'boxes' in space. It's obvious, though,
that the programs would become unmanageably complex. Based on experience so far, the 'plane plotting routine' is best recommended only for the following three cases: 1. Single 'floor' or 'wall' 2. Multiple parallel 'floors' or 'walls' 3. Single or multiple 'parallel' surfaces of which one example is given here (generated from the original 'floor' routine): 520 REM 'Sine surface 'roof', y=+40'IN PART TWOThe generation of 3D objects using spherical co-ordinates will explain the role of parameters in INPUT statements - some examples of which appear in Part 1.Suggestions for further reading 1. WM Newman, RF Sproull, Principles of Interactive Computer Graphics, McGraw-Hill, 1979 2. Nick Hampshire, Spectrum Graphics, Duckworth, 1982 3. 'Spectrum 3D Rotator', page 80, Your Computer, July 1983 |
APPENDIXPERSPECTIVE TRANSFORMATIONPOINT PROJECTIONSxp/d = x/zxp = x * d/z..............(1a) x/z <= w/d x <= z * w/d..............(2a) yp/d = y/z yp = y * d/z..............(1a) y/z <= h/d y <= z * h/d..............(2a) Point transformation (Figure 1) is derived from similar triangles, Odxp and Ozx, for x; this can also be seen for y. This transformation is used to plot points using the PLOT statement. The viewing pyramid determines the 3D space in the front and back of the screen which can be used without clipping (see equations 2a). VECTOR PROJECTIONSdxp = dx * d/z + x * dkdyp = dy * d/z + y * dk...(3a) The combined (total) vector projection is shown in Figure 2. 'Vector transformation' is used with the Spectrum DRAW statement in order to draw projections of increments (vectors) dx, dy and dz. 1. Projections of dx and dy are derived in the same manner as projections of individual points (see Figure 3). dxp = dx * d/z dyp = dy * d/z............(4a) 2. The projection of dz is derived via dk. dk is defined as the decrement of the perspective scale factor (k= d/z) due to (only) an increase of z by dz: dk = (d/(z+dz))-dz........(5a) Referring to Figure 4 and applying the standard point transformation (see equations 1a) for the points P1 (x1,y1,z) and P2 (x1,y1,z+dz), the following can be derived: xp1 = x1 * d/z, xp2 = x1 * d/(z+dz) yp1 = y1 * d/z, yp2 = y1 * d/(z+dz) ..........(6a) Since, dxp = xp2 - xp1 = x1 * d/(z+dz) - x1*d/z = x1 * (d/(z+dz)-d/z)) = x1 * dk ie. dxp (due to only dz) = x * dk dyp (due to only dz) = y * dk ..........(7a) The combined effect of all three increments, dx, dy and dz, is therefore a sum of all component projections (see equations 3a and Figure 2). The equations are now repeated for convenience: dxp(tot) = dx * d/z + x * dk dyp(tot) = dy * d/z + y * dk due to due to dx or dy dz only |

| ||
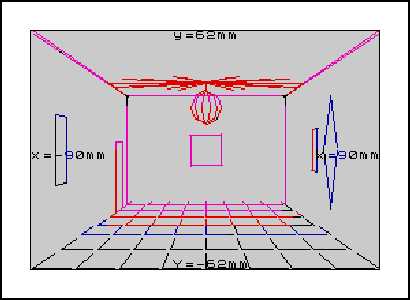
| Using the 3D Plotting program and the tabulated parameter examples, this is what you should end up with on the screen. Why not have a go with some of your own parameters and see what you come up with ... | ||

|
|---|
| Home | Contents | KwikPik |