Your Spectrum
Issue 3, May 1984 - QL User supplement
Home QL User index
Soft Sells
The old story that software sells computers is taken to heart on the QL where the four Psion packages that come with the machine provide serious business tools at a home micro price. Quentin Lowe has a look at the software that maketh the machine ...


QL QUILL

The word processor QL Quill is going to be the predominant influence on QL sales. For a mere £400 plus the cost of a printer, it allows the QL to be used as a serious small word processing tool - breaking, for many newcomers, a genuine price barrier.
Quill is a serious grown-up word processor - text appears on screen in the same format it will be printed - and if you want justified text, it's justified as you type. Page breaks occur visibly on the screen, underlined text is underlined and bold text is highlighted in a different colour. Forgetting all the arguments about what is and what isn't wanted in an editor, this system makes Quill very simple to learn and use.
There are all the usual features - search and replace, block copies and moves and so on. You also get the luxury of a glossary feature - any frequently needed phrase (or set of commands!) can be assigned to a particular letter key ready for instant recall. Quill even saves the glossary to its Microdrive between sessions so it's always there when you work.
Its most serious limitation is one which affects many small machine packages - the maximum amount of text that can be edited at any one time. With Quill, it's likely to be around ten pages - enough for letters, reports and so on but perhaps a restriction for some people. Even so, there's no doubt that Quill is good enough for its challenging role.

QL ABACUS

Abacus provides a serious spread- sheet package on a par with top selling programs like Multiplan and VisiCalc. Although QL User has yet to have the chance to perform formal benchmarks, the program is very responsive in use. What's more, Psion seems to have actually introduced one or two sensible and welcome extensions to the facilities normally available in spreadsheets.
The first is cell labelling. Traditionally, each cell in a spreadsheet has been named by co-ordinates, such as A1, B2 or R3C4 and so on. Some newer packages have had a labelling facility where you can give cells sensible names. With Abacus, all text in the sheet can be used as labels - the program automatically deduces which cells to use when you use a label in a command.
And Abacus is extremely good at text as well as numbers. There are lots of functions dealing with character information (such as INSTR, CODE, UPPER, LOWER and so on), making it easy to generate really comprehensible and easy- to- use models. This ability should open up many more applications for Abacus, making it one spreadsheet that's suitable for more than just accounts.
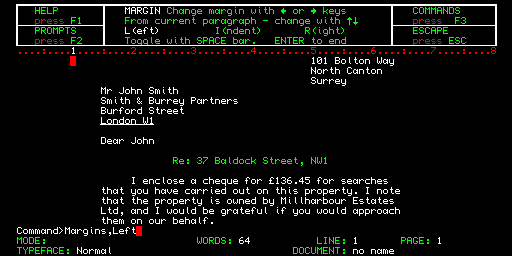
QUILL When you want to underline a line of text, the underlining is actually displayed on-screen.
You adjust the left margin simply by positioning the cursor along the ruler line.

The command line is used to build up instructions in a step- by- step approach. Here the user is instructing the word processor to adjust the left margin.
Quill screen Pressing the function key 'F2' provides you with the 'prompts' box. Here the margin command is being executed. Pressing the 'F1' and 'F3' function keys give you 'Help' with the package and a list of the commands you can use with Quill, respectively.
The default mode is used to insert text at the position of the cursor. Just in case you get too carried away, there's a continuous word count on-screen. Bold text is highlighted in green.
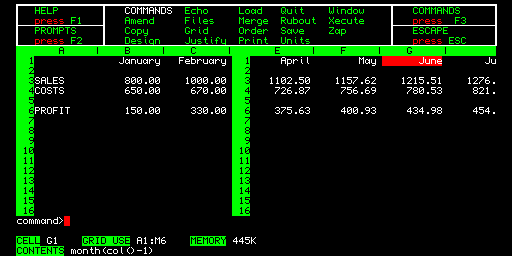
ABACUS Having pressed the 'F3' function key, the 'Commands' box appears on-screen, providing you with a list of the commands that can be used with Abacus.
Cell references can be made via the traditional A1, B1, etc, or by automatic text labels.

Should you wish to access any cell, this is easily done by typing 'Profit.March', for example. This can also be accessed in the shorter form 'Prof.Mar'. Specifying the row and column intersection labels allows the package to deduce the cell you wish to manipulate automatically.
Abacus screen The red cursor highlights the current cell you are operating on - in this case, June.

On Abacus, this row is always labelled 'Profit'.
The formula to reference any cell is always visible on-screen. The screen can be split into two windows, both of which can be optionally linked to move in tandem. Using the reference 'May', you can manipulate this whole column.

ARCHIVE
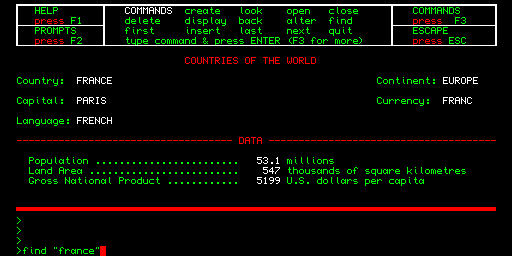
Along with the Archive package, you get a sample file called Gazetteer - the one that has always been part of Psion's VU-File program for the Spectrum.

Of all the packages supplied with the QL, Archive is the only one that is command- line driven. You can either use the commands already built into the package or you can define your own procedures.
Archive screen Pressing the 'F3' function key allows you to see all the commands you may wish to use on Archive. These allow you to use the QL as a simple card index.

Here the screen layout used is the one that is set up by default by the package itself. However, you can also access the database with a number of different layouts of your own design.

QL ARCHIVE

Archive is a heavyweight database package with the added attraction that it can be operated on a simple level with no more trouble than a trivial program (such as Psion's own Vu-file) on the Speccy. To do this, Psion has gone for a now traditional card index format, with each entry in the database effectively being its own 'card' and being divided up into separate fields of information.
A set of simple commands have been added to let you introduce new records, search for information and so on. And the clever bit is that you then discover a whole new programming language hidden away inside Archive. lt's at a higher level than Basic - with powerful English- like commands and a special intelligent editor that takes care of program layout for you. Archive has commands that let you have a number of different screen layouts with any one file, combine different files and so on.
The result is that you can customise Archive exactly to a particular application, in much the same way as packages such as dBase II. All that power does make it the hardest of the four packages to learn, although you can get into it very easily just by starting off with a simple card index. However, compared to most products of a similar capability, even the most complex of Archive procedures is relatively easy ...

QL EASEL

Easel is one of those packages that's good for a quick thrill - a sort of 'what can it do then?' program that gives instant and dramatic results. It's designed to produce business graphics - bar charts, line graphs, pie charts and so on - and in an area that's still relatively new to computing, Easel is likely to be something of a pioneering program.
Most business graphics packages are turgid programs that are either too complex to be practical or too restrictive to be of use. Easel is really easy. It's based around complete named sets of data- which may have been typed in, imported from another program (Abacus perhaps!) or even derived from existing sets of data using Easel's built-in simple calculation facilities. Once in, you can graph any of the data in any way you like - mixing different sets on the same graph, tipping the graph sideways, customising the design of the bars and background right down to carefully adding special labels, and positioning the key where you want it. You can also make further cosmetic changes to the graph, such as colour alterations, solid outlines and 'filled-in' areas.
All the time Easel provides sensible suggestions for things you've not specifically detailed. It scales and labels the axes and provides a key; you can also do as little or as much work as you like on achieving the perfect final product. Compared to other top business graphics packages, Easel doesn't offer any dramatic new abilities. What it does provide, however, is a system that's so quick and easy to use that you don't mind messing about getting the best result - an ideal tool for producing effective graphs in the minimum of time.
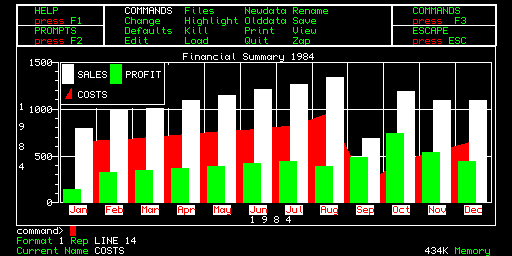
EASEL You will automatically get a key to the graph on-screen as a guide to what each colour represents.
According to the data you provide the package, the axes are automatically scaled and labelled.

This is an indication that the current set of data being worked on is 'Costs'. Sales and Profits have already been dealt with as separate items of data and have been plotted on-screen. Should you wish to manipulate data already on-screen, you can edit them using the 'Olddata' command.
Easel screen The graph shown in the screen shot is an overlapped bar chart illustrating sales and profits, complete with the costs superimposed as a line graph filled to the X-axis.

All the packages provided on the QL utilise the 'percentage memory left' device, popularised by Microsoft. This gives you a non- technical indication of free memory.
Home QL User index