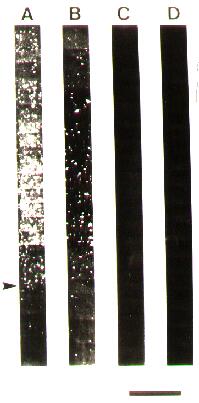
Right: The focal distribution of aluminium (Al) within the cerebral cortex of renal
dialysis patients shown using SIMS. A and B area photo- montages of numerous focal aluminium deposits in the grey matter of the frontal cortex from 2 dialysis patients. C and D show a lack of such focal accumulations in the cortex of two control patients. The arrow head marks the grey/white matter border. Calibration bar = 800 um. |
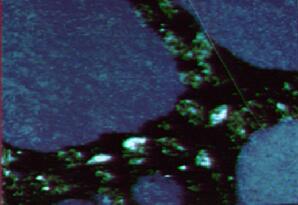
Above: High resolution SIMS image recorded from a thyriod gland showing the distribution
of iodine (blue) in the follicular region and phosporus (bright green) in
the surrounding cells. Image field view is 50um. |
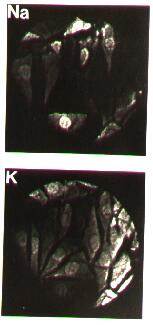
Above: Corresponding SIMS images of sodium (Na) and potassium (K) distribution in ovary cell cultures using a freeze fracture specimen preparation technique. Field = 150um diameter. |
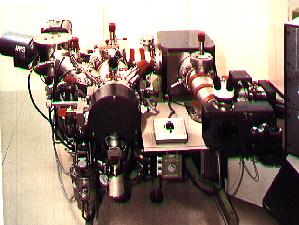
The SIMS Technique The ion microscope SIMS, such as the CAMECA IMS 3f shown, is based on sputtering atoms from the surface of a solid sample when bombarding it with ions. Secondary ions leave the specimen surface and are extracted into a double focussed mass spectrometer. An electrostatic analyser disperses these according to their energies and a magnetic sector seperates them according to their mass to charge ratio. The mass resolved ions are then subjected to various forms of detection: |
These can be counted in a photomultiplier or projected onto a microchannel plate/phosphor
screen to form a 2D image of the ions up to 400 um in diameter.
This visible image can be integrated using a cooled CCD imaging system and stored
for processing. Continuous sputtering of the specimen surface causes the tissue
surface to be eroded at the rate of 1-10 atomic layers per second, and thus
images can be recorded from successive depths to create a 3D image. |
The CAMECA IMS 3F ion microscope |
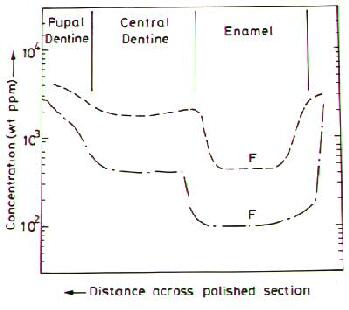
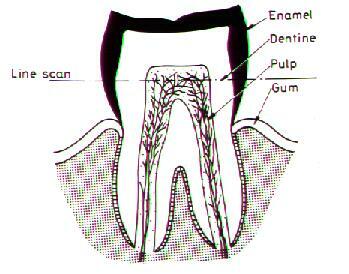
Left: Cross-section of a human tooth. During life and into post-mortem, flourine (F) diffuses
into the interior of dental enamel at a near constant rate realtively
independent of F levels in the environment. The archeological age of the tooth
has a linear relationship with F concentration in the mid-enamel plateau region.
Left figure: The broken lower line is typical of F levels in a recently extracted tooth of a young adult (control). The dashed upper curve is from a young female warrior buried about 1800 BC. The lower plateau regions in the inner enamel and central dentine can be used for quantitative temporal comparison between different individuals teeth. Using this difference, SIMS provides a new tool for archeolgical dating. |
In the field of biological and medical analysis there is a great deal of interest
in determining the location and distribution of trace elements in relation to
specific body tissues and cellular features. Secondary ion mass spectrometry (SIMS)
meets these requirements and is capable of producing elemental images images
with high spatial resolution (1 to 0.01 um, depending on machine), combined
with high elemental sensitivity down to trace concentrations (<1 ppm). SIMS
has been used succesfully on mineralised tissue work such as analysis of teeth,
and soft tissue studies using major organs or cells. |
Secondary Ion Mass Spectrometry |
With acknowledgement to HB and SM of AEA Technology, UK, who run the companies two SIMS facilities (one ion microscope and one ion microprobe
SIMS machine). Each machine costs around one million pounds. |
Return to Index Page |
Return to Home Page |
Biological microanalysis using SIMS |
Visit AEAT's SIMS site |